U.S.–China Tariffs and Why Data Analysis Matters More Than Ever
Why Data Analysis Is More Important Than Ever
At the very basis of the argument, a tariff imposed on other countries’ exports to the U.S. will result in U.S. importers paying more money for goods. These tariffs will sometimes be eaten by the importer or passed down the chain, eventually reaching the consumer. This is why businesses need to understand their financials and track them—so they stay informed and make decisions in real time instead of waiting weeks or months to get the necessary information. In today’s competitive, fast-moving economy, speed and accuracy matter.
So What Does All of This Mean for Your Business?
Now more than ever, it’s critical to understand your financials. As costs shift, so do your margins, expenses, and revenue forecasts. Companies that rely on manual reporting or fragmented tools will fall behind. You can’t afford to wait weeks to understand what's happening.
Visualizing key business metrics—revenue, costs, margins, customer churn—helps companies stay agile. It gives leaders the clarity needed to act before a small problem becomes a major issue.
If you’re still tracking everything in Excel or across multiple disconnected systems, you’re likely spending hours aggregating data, only to get incomplete answers. A modern dashboarding tool like Power BI helps you track sales, expenses, margins, and other KPIs by customer, product, location, and more.
Example: The Power of Asking “Why?”
With visual tools, you can dig deeper. Let’s say:
Why did sales drop by 8% in Q4 2025?
→ You lost 10% of existing customers.Why did you lose 10% of customers?
→ They were frustrated with rising prices.Why did you raise prices?
→ Costs of key technical components—plastics, semiconductor chips, and LED screens—went up.Why did those costs go up?
→ Your suppliers raised prices due to new tariffs.
This is the kind of insight a good dashboard delivers in seconds—not days.
Real-World Examples of Data Wins
Here are a few ways I’ve helped businesses unlock insights and boost profitability:
Built customer risk and performance dashboards that helped a recruiting firm grow revenue by 8%.
Used Python and Power BI to redesign pricing strategies, increasing revenue by 6% across 500 contracts.
Identified upsell opportunities through data analysis, growing sales by 8% in one month.
Created dashboards that visualized financial performance for large accounts, enabling better decision-making under rising cost pressure.
Streamlined sales funnel reporting to identify slowdowns in the process and eliminate bottlenecks.
My intention with this article wasn’t to sway your opinion or voice my stance on the current administration. I’m not trying to tell anybody what to believe or make a political statement. I simply wanted to learn more about the tariffs and write an article that connects current events to the financial dashboards I’ve built.
I am, of course, human—and my writing style is often influenced by my prior experiences. However, I tried to report on what’s occurring rather than give my opinion on whether this is good or bad or whether it will result in economic prosperity or recession.
There are people more knowledgeable about economics, and I’m by no means an expert. So why did I write this? Simply, I’m interested in the topic, and I thought this was a great way to talk about the dashboards I’ve created and the value they offer—especially during times of economic uncertainty. I also want to become more politically knowledgeable, and this project felt like a great way to dive deeper and stay informed.
This is just one article—there are many like it, but this one is mine. I didn’t research everything, and I welcome discussion on the topics addressed in this article, or on other topics like research methods or data analysis. While I enjoyed writing this, I admit I’m not a journalist or economic expert. But this assignment made me think more about tariffs, listen to press conferences, and write an article rooted in the research and visuals I gathered. I’m far from finished researching this topic and look forward to updating this blog as we see the effects of these tariffs and future policy changes.
An Op-Ed and Research-Style Paper on U.S.–China Tariffs and Why Data Analysis Matters More Than Ever
With new tariffs now in place on a range of goods—including automotive, electronics, construction and homebuilding materials, retail (like toys/games), oil/gas, and agriculture—prices for American importers are set to rise. These increased costs are often passed down to American consumers.
Example: A phone or computer repair shop. If you crack your screen and go in for a replacement, that shop likely sources parts from outside the U.S. According to the United States International Trade Commission, 35% of U.S. electronics imports came from China in 2019. Amid the current U.S.–China trade war, businesses are facing tough decisions about how to handle cost increases directly tied to rising import prices.

How Can a Dashboard Help This Business?
Keeping an eye on your costs—and understanding how they’ll affect your business over time—lets you better plan for the coming weeks and months. You might need to change your strategy or find a different supplier to offset tariff-related increases. You’ll also want to monitor competitors, their pricing, and market share to stay competitive.
Without metrics and KPIs, your business is flying blind—and that can lead to serious issues.
This past weekend (May 10–11), the U.S. and China met for the first time since the trade war reignited during Trump’s first administration. It’s worth noting that the two countries were working on a deal back in January 2020 that ultimately didn’t amount to much. In a recent press conference, President Trump reiterated that he blames the Biden administration for the failure of that earlier deal. I haven’t researched that claim yet, but I’d like to explore it more and expand this article with additional context.
On May 9, Trump posted on Truth Social:
“80% Tariff on China seems right! Up to Scott B.”
("Scott B." refers to Treasury Secretary Scott Bessent.)

This implied a pullback from the 145% tariffs announced on April 2—what Trump called “Liberation Day.”
However, this may have been a negotiation tactic. On May 12, both administrations agreed to a reduction in tariffs. The U.S. lowered tariffs on Chinese exports to 30%, the lowest since February 4, 2025. China lowered theirs from 125% to 10%, the lowest since 2018.
“We do want trade. We want more balanced trade, and I think both sides are committed to achieving that,” Bessent said, adding that the Trump administration would push for China to open up more to U.S. goods. China’s trade surplus with the U.S. topped $100 billion last year.
Trump continues to argue that trade deficits are harmful to the U.S. economy. He says countries with trade surpluses often don’t buy American products like beef, eggs, and poultry, yet the U.S. imports from them heavily.
The Trump administration claims that tariffs will:
Cut the trade deficit
Bring manufacturing jobs back to America
Help pay down U.S. debt using tariff revenue
They also believe this deal will boost exports to China and strengthen the overall trade relationship. While this remains a dynamic and unstable issue—one that’s persisted since Trump’s first term—the next 90 days should offer a period of relative calm if the agreement holds.
The S&P 500 climbed 3% in reaction to the news. While the market has dropped 5% since its February 9 high, that peak was also the highest in history. Some market pullback was likely due, and recent softening of the tariff stance appears to be restoring investor confidence.

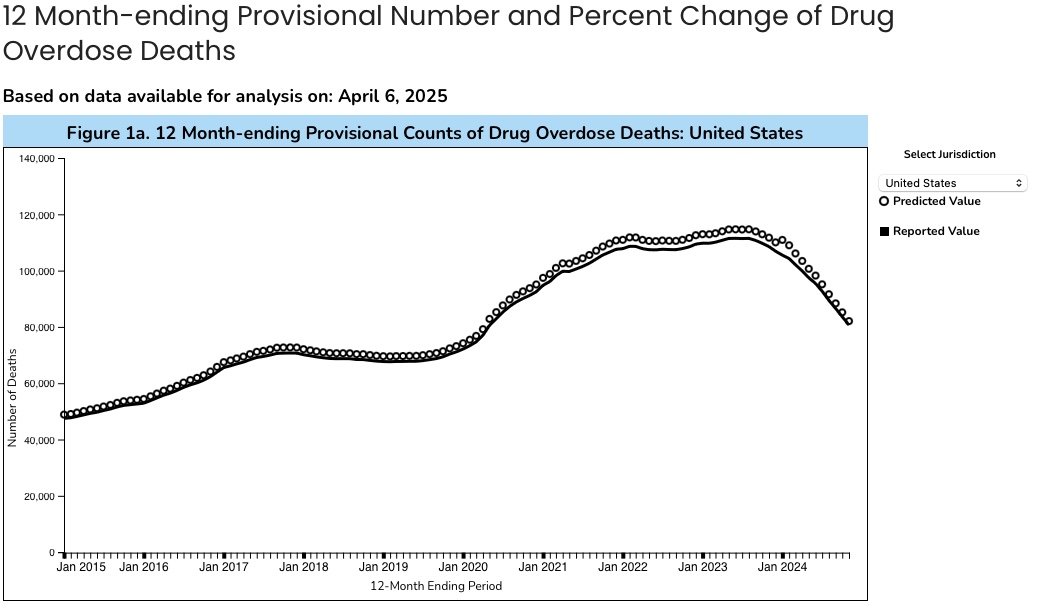
In Geneva, this weekend’s trade talks excluded several categories from tariff reductions: steel, cars, aluminum, and pharma. Also excluded was the 20% fentanyl-related tariff aimed at China’s role in the opioid crisis. According to the CDC, recent drops in overdose deaths are attributed to increased access to naloxone, better treatment access, and improved prevention programs like OD2A.
While this data cuts off in 2024—before the fentanyl tariff went into effect—it’s fair to assume this new tool will be combined with the existing ones to further reduce overdose deaths.
Business Impact
Both small businesses and large corporations will feel the effects. But small businesses often don’t have the same ability to absorb increased costs. They’ll have to choose:
Absorb the cost → Lower margins
Pass it to the customer → Lower conversions, higher churn
Example: Best Buy charges ~$200 for an iPhone screen repair. If the screen costs $50, that’s 25% of the total price. With an 80% tariff, that $50 becomes $90. The business must either pass on the $40 difference or absorb it. If absorbed, gross margin drops from 75% to 55%, even before labor or rent.
According to NYU Stern, gross margins in electronics retail average ~30%. That means even minor cost increases can have serious impact.
Trump says he’s playing the long game—believing tariffs will bring back industrial growth similar to the late 1800s and early 1900s.
He’s also highlighted growth in U.S. manufacturing and automotive deals, including reports that Apple may open new U.S. plants.
In an interview with CNBC, William Lee, Miken Institute Chief economist said it will be very costly to restructure the economy like President Trump wants to do. This is going to take some complex surgery to restructure the economy in a way that improves domestic income and employment while also reducing level of imports. A trade deficit isn’t bad and shows we have money to spend but President Trump wants to spend money with our friends not enemies.
In the same interview, Peter Boockvar, CIO at Bleakly Financial Group said he thinks the Tariffs are terrible policy. A trade deficit is a biproduct of global trade. While we do want to manufacture more things in U.S. and knock down overseas trade barriers, trade deficit aren’t necessarily a bad thing. It is a flawed economic concept.
When asked about rising prices in toys, baby products, tires, and clothing, Trump said these were “peanuts” compared to energy costs. That’s an oversimplification—while gas prices do matter to Americans, spending patterns extend beyond gas and groceries.
According to the U.S. Energy Information Administration, gas is up 1.6% since Trump took office ($3.247 → $3.299). Trump also referenced declines in grocery, energy, and mortgage prices.
While the article is centered on tariffs and their effect on import prices, I’ve included charts on these items as well—since they’re often cited in discussions about economic health.


NOTE: Data available through March 2025. Future updates will reflect new data as it becomes available.
Final Thoughts
While we monitor the economy and Tariff policy put in place, we need to see if the plan President Trump put in place will be successful. While this happens, understanding your operations and financials side-by-side gives you an edge. It helps you cut through the noise and stay focused on what truly moves the business forward.
If you're a business owner, data enthusiast, or operations lead trying to navigate rising costs and tighter margins, visit jakelender.com or reach out. I’d love to hear how you’re approaching these challenges.
#PowerBI #DataAnalytics #BusinessIntelligence